In the first post of this series, I registered Cursor’s 21 hooks and built a passive .NET observer that saves their JSON payloads and forwards them to a WPF viewer. At that point, I knew which hooks were triggered and what each payload contained.
Unfortunately, a folder full of JSON files is not a conversation.
For one user prompt I could receive thoughts, generic tool hooks, specialized Shell or MCP hooks, file events, a final response and a stop notification. Some tool calls were sequential, others overlapped. To answer the questions that started this research—did the agent load my skill, which MCP did it call, and in which context?—I had to reconstruct the relationships between all these events.
This is the second post in the series:
- Spying on Cursor: agent hooks, payloads and a simple observer
- Rebuilding the conversation: sessions, turns, thoughts, tools, MCP, skills and summaries (this post)
- Spying on Claude Code: more lifecycle events, different blind spots
- Spying on GitHub Copilot twice: CLI hooks versus VS Code
- Beyond hooks: mining undocumented agent transcript logs
The POC from the first post has since evolved into the shared HarnessSpy implementation used here. The capture remains passive; this post focuses on what happens after a payload reaches the viewer.
From a bag of events to a conversation
The two easiest relationships come directly from fields introduced in the first post:
conversation_ididentifies the session,generation_ididentifies everything triggered by one user prompt—what I call a turn.
The initial projection is therefore:
Workspace
└── Session (conversation_id)
    ├── sessionStart
    ├── Turn 1 (generation_id)
    │   ├── beforeSubmitPrompt
    │   ├── afterAgentThought
    │   ├── ...
    │   ├── afterAgentResponse
    │   └── stop
    ├── Turn 2 (generation_id)
    │   └── ...
    └── sessionEnd
workspaceOpen belongs directly to the workspace. sessionStart and sessionEnd bracket the entire conversation, so they stay at session level even if Cursor stamps them with a generation_id. Tab-completion hooks also stay at session level because they describe editor activity, not an Agent turn.
The turn label starts as Turn 1, then becomes Turn 1 · <prompt preview> when beforeSubmitPrompt arrives. The session itself uses the first prompt as a readable title instead of displaying an opaque GUID.
So far, nothing is really heuristic: I am mostly grouping by native IDs. Tools are where this gets more interesting.
The ID that was not quite an ID
My first implementation matched preToolUse and postToolUse using tool_use_id. It looked like the obvious correlation key provided by the payload:
| |
Then I found several calls in one turn sharing the same tool ID. Timestamps are not a safe replacement. Imagine two calls starting before either one completes:
| |
Matching by arrival order links post B to pre A, precisely the opposite of what happened.
I had made a classic observability mistake: assuming that a field named “ID” was necessarily unique. HarnessSpy now narrows unfinished preToolUse candidates by:
tool_use_id,tool_name.
It then requires one unique best match based on the value of tool_input. Only one best candidate is accepted. If two unfinished calls have the same ID, name and input, the code does not pick the first one and pretend to know. The postToolUse stays as an orphan directly under the turn node. An incomplete tree is better than a convincing but false one.tool_use_id is still the mandatory first gate. If a post event does not contain one, HarnessSpy leaves it at turn level even when its tool name or input looks familiar.
Even more JSON
In pre/post payloads,tool_input value is a json element containing the tool parameters as fields:
| |
MCP inputs add another variation: the value may be an object in preToolUse but is a JSON-encoded string in beforeMCPExecution:
| |
Before comparing an input, ToolCorrelationMatcher:
- parses it if it is a JSON object/array encoded as a string,
- sorts object properties recursively,
- preserves array order,
- serializes the result into one canonical representation.
Shells inside tools inside turns
A single shell command usually appears through two hook layers:
preToolUse (Shell)
├── beforeShellExecution
│   └── afterShellExecution
└── postToolUse (Shell)
Only the pre/post payloads contain a tool_use_id field. So it is not possible to use it to figure out which shell events will match. Let’s see what else can be used.
The generic preToolUse/postToolUse pair describes the model’s tool invocation
| |
The specialized shell pair provides the full command, working directory, sandbox state in before, and output plus execution duration in after:
| |
Originally, the code generated by Cursor linked beforeShellExecution to the most recent unfinished Shell tool, then linked afterShellExecution using a LIFO stack. This works until commands overlap and finish in a different order:
| |
The stronger matcher scores shared evidence instead:
| Evidence | Weight | Normalization |
|---|---|---|
command | 100 | Line endings normalized; command otherwise kept case-sensitive |
cwd / working_directory | 20 | Slash direction normalized; compared case-insensitively |
sandbox | 5 | Exact Boolean value |
A shared field with a different value rejects the candidate. Missing fields neither match nor reject; they simply add no evidence. The highest unique score wins. A tie remains uncorrelated.
The same matcher is used twice: first to attach beforeShellExecution to the generic Shell call, then to attach afterShellExecution to its matching before node. Arrival order is no longer used to define identity.
If the specialized before event is missing but one generic Shell candidate can still be identified, the afterShellExecution event is attached directly beneath it. This keeps partial captures useful without inventing an intermediate event.
MCP: the same puzzle with another JSON layer
MCP calls follow the same shape as shell calls, with slightly different names:
preToolUse (MCP:get_parallel_stacks)
├── beforeMCPExecution (get_parallel_stacks)
│   └── afterMCPExecution
└── postToolUse (MCP:get_parallel_stacks)
Again, the generic hook payloads contain the same tool_use_id but it does not appear in the specialized before/after. This time, the tool_name field prefixes the tool name with MCP:
| |
The specialized MCP hook payload uses the exposed tool name (without MCP: prefix):
| |
It may also add mcp_server_name, url or the server command as fields. As already mention at the beginning of this section, its tool_input is a JSON string containing the MCP tool parameters.
So, for MCP tool calls, the matcher uses:
| Evidence | Weight |
|---|---|
tool_input | 100 |
mcp_server_name | 40 |
| Server URL | 30 |
Tool name, after removing MCP: | 20 |
| Server command | 20 |
This lets two concurrent calls to get_duplicated_strings share the same tool_use_id and still be separated by their inputs:
get_duplicated_strings(dumpPath = A.dmp, countThreshold = 10)
get_duplicated_strings(dumpPath = B.dmp, countThreshold = 20)
Again, this is evidence, not certainty. If both calls use the same server, tool and input, the observable payloads do not contain enough information to distinguish them. However, a model would not be very smart to ask for the exact same MCP tool calls in a row…
File hooks use a path fingerprint, not an ID
The file read/write hooks are following a similar pattern:
    preToolUse (Read - foo.txt)
    ├── beforeReadFile (foo.txt)
    └── postToolUse (Read - foo.txt)

    preToolUse (Write - bar.md)
    ├── AfterFileEdit (bar.md)
    └── postToolUse (Write - bar.md)
Like for shell and MCP, beforeReadFile and afterFileEdit carry no tool_use_id, so they cannot use the exact ID matcher that pairs generic preToolUse/postToolUse events. They do, as detailed in the first post of the series, carry a file_path, and the owning Read/Write/StrReplace/EditNotebook call exposes the same path inside its tool_input. That shared path becomes the correlation fingerprint: beforeReadFile attaches to the Read targeting the same file; afterFileEdit attaches to the Write, StrReplace or EditNotebook targeting it. The top-level file_path and the tool_input path can differ in slash direction and casing, so both are normalized before comparison.
And what about failures?
The postToolUseFailure hook is the unsuccessful equivalent of postToolUse. According to Cursor’s hook schema, its payload includes:
failure_type:error,timeoutorpermission_denied,error_message: text describing the issue leading to the error,is_interruptas a boolean to indicate if it was cancelled by the user,durationfor the time spent before failure.
It goes through the same ID/name/input matcher.
Failures are expanded in the tree rather than collapsed, making the error payload immediately visible. it is interesting to note that the failures hooks are following the same pattern as postToolUse hooks; i.e. the afterShellExecution is still present with the same duration as what is provided by the failure payload:
    preToolUse (shell)
    ├── beforeShellExecution (dotnet --version...)
    │   └── afterShellExecution (dotnet --version...)
    └── postToolUseFailure (shell)
leads to the following nodes in the spy UI:

Parallel is not the same as unordered
Once calls have a start and end, overlapping intervals can be grouped under a visual node:
Turn 1
└── ∥ Parallel · 3 calls
    ├── Grep
    ├── Read
    └── WebSearch
The interval starts at preToolUse. Its end comes from the matching post event; native duration is used for the call badge when available, otherwise the viewer falls back to the difference between observed timestamps.
Two calls belong to the same parallel wave when their intervals overlap. That is a viewer heuristic, not a batch identifier supplied by Cursor.
It also explains why durations must not simply be added. Three one-second calls running together have roughly one second of wall time, not three.
Subagents have a better key
Within a turn, subagent pairing is simple. subagentStart is kept in an in-flight dictionary by subagent_id; a matching subagentStop becomes its child and supplies the final status and duration:
subagentStart (explore)
└── subagentStop (completed)
This solves start/stop nesting inside the observed turn. It does not solve the harder problem mentioned in the first post: linking every separate subagent conversation or transcript back to its parent session when the emitted payloads do not expose a reliable relationship.
Which skills were actually used?
I was surprised to find no skillLoaded or skillUsed hook. Since a skill is defined in a SKILL.md file, HarnessSpy looks for observable evidence around that file name.
The strongest signal: reading SKILL.md
TargetFilePath is extracted from a file_path field or from tool_input.file_path / tool_input.path. If the filename is SKILL.md, its parent folder becomes the skill ID:
| |
For example:
C:\Users\me\.cursor\skills\dotnet-memory-analysis\SKILL.md
becomes:
dotnet-memory-analysis
Repeated reads are deduplicated in the turn/session summary, although they still count as separate Read tool calls.
Slash commands show intent
In beforeSubmitPrompt, you can find the /action commands used in a prompt. So, HarnessSpy keeps those that looks “good” such as /dotnet-memory-analysis while rejecting fragments of URLs and Windows paths.
These values appear under Commands, not Skills. A slash invocation proves what the user requested, but it does not prove that the corresponding SKILL.md was read.
This distinction catches an interesting situation:
Command: /dotnet-memory-analysis
Skill read: dotnet-threads-analysis
The user asked for one workflow; the harness actually loaded another.
Thought mentions are only supporting evidence
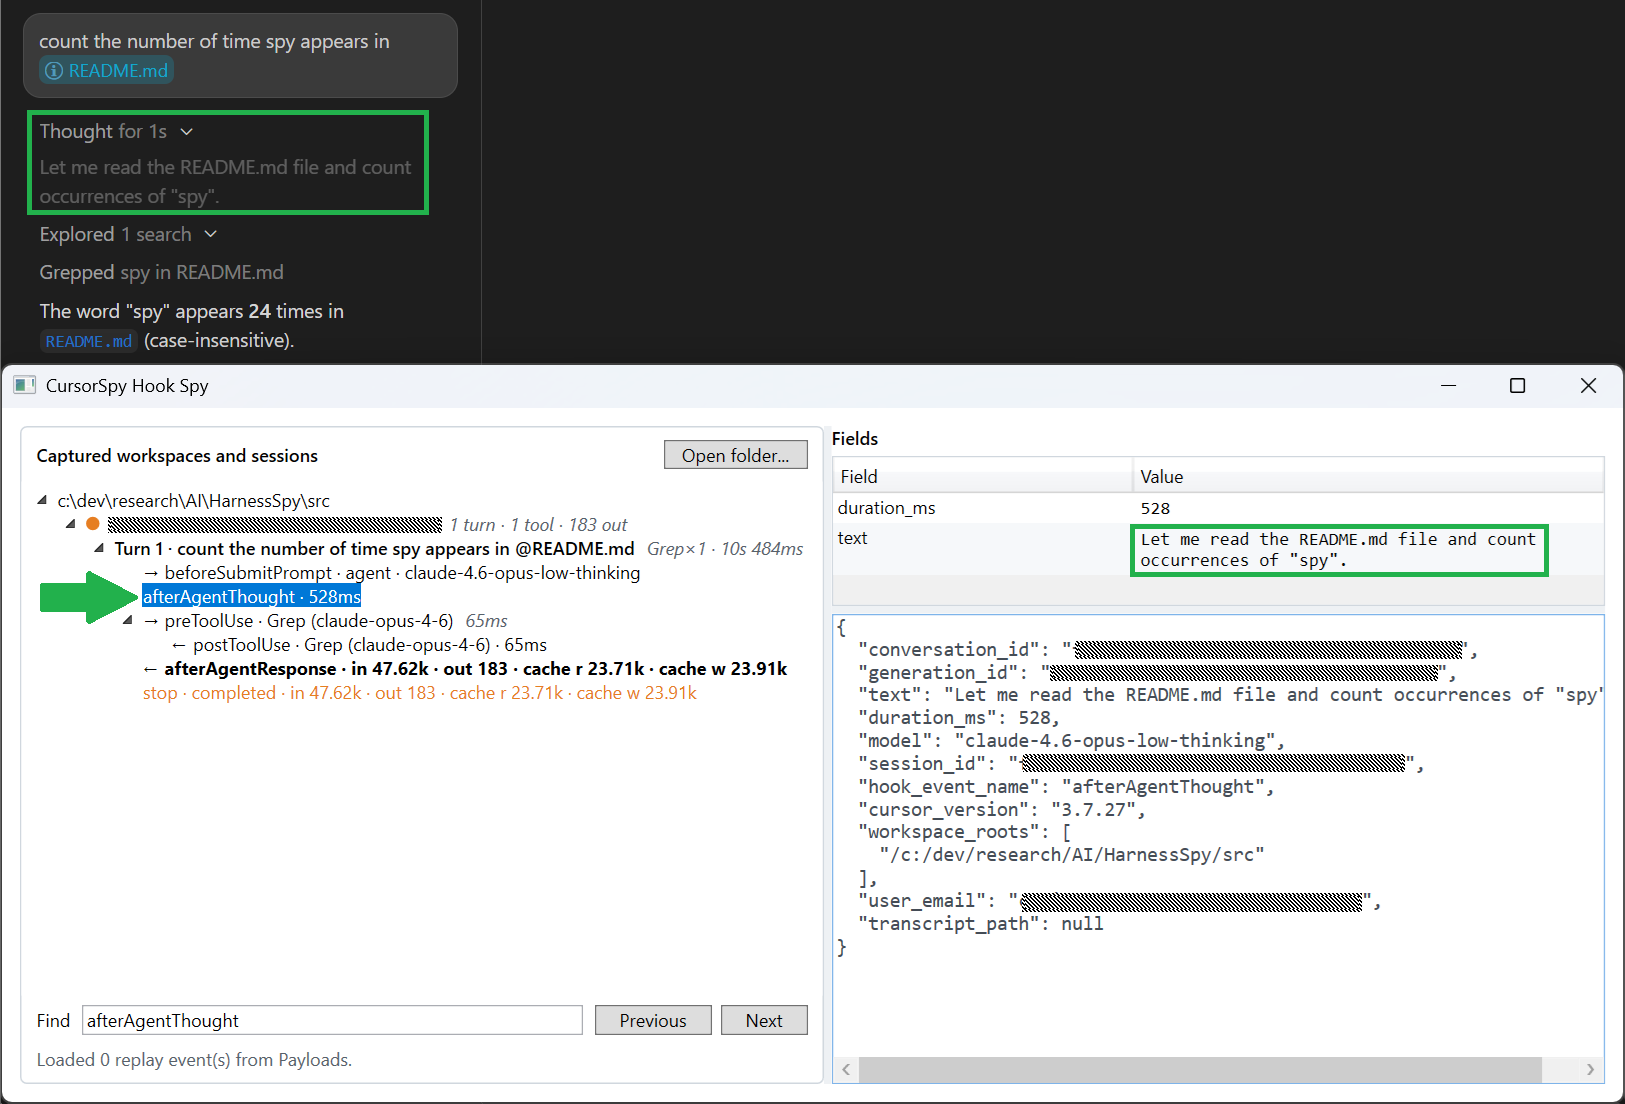
The afterAgentThought payload text field contains what is displayed by Cursor when thinking:

From the same afterAgentThought, HarnessSpy also analyzes phrases to identify skills such as:
follow the dotnet-memory-analysis skill
The matcher deliberately requires a hyphenated ID followed by the word skill, avoiding generic phrases such as “this skill”. This is obviously a Cursor-specific heuristic, and certainly not proof that the file was loaded or followed correctly.
The three signals have different meanings:
| Signal | What it supports | What it does not prove |
|---|---|---|
Read of <id>/SKILL.md | The harness accessed that skill file | Every instruction was retained or followed |
/id in the user prompt | Explicit command/invocation intent | The skill was loaded |
<id> skill in a thought | The visible reasoning mentioned it | The skill was read or executed |
There are unavoidable false positives and negatives. Any unrelated file named SKILL.md matches the path rule, while a skill injected implicitly into context without a Read event remains invisible.
The summary dashboard currently merges SKILL.md reads and thought mentions into the same Skills list; it does not make their provenance explicit. Commands remains separate because it represents invocation intent rather than observed loading.
From tree nodes to a summary dashboard
Once the events are nested, NodeSummaryBuilder recursively walks a turn or a complete session and accumulates:
| Summary | Evidence |
|---|---|
| Wall time | First to last observed event |
| Tools | Count on preToolUse, duration on matching postToolUse |
| MCP | Count/duration from Cursor’s dedicated MCP hooks, grouped by server/tool |
| Thoughts | Number of blocks, character count and duration |
| Skills | Distinct SKILL.md reads and supported thought mentions |
| Slash commands | Distinct /name from submitted prompts |
| Files | Distinct paths from afterFileEdit |
| Subagents | Type, task preview, status and duration |
| Tokens | Input, output, cache-read and cache-write snapshots |
| Status badges | Tool failures and aborted turns |
For one turn, this gives a compact answer to “what happened?” For a session, skills and commands become a union across turns, output/cache-write tokens are summed, and the latest input/cache-read snapshot represents the current accumulated context. I have to admit that I don’t really know what these number represent…
There is a deliberate separation between normal tools and MCP tools. A generic tool named MCP:<name> is excluded from the normal tool count; Cursor’s dedicated beforeMCPExecution/afterMCPExecution pair feeds the MCP table instead, avoiding double counting.
The resulting summary is useful, but it should not be mistaken for billing data or a provider trace. It is a summary of the events that reached this observer.
It also contains sensitive prompts, commands, paths, tool results and skill names. The plaintext-capture warning from the first post still applies to the reconstructed view based on the same json files.
Four kinds of truth
The reconstructed tree mixes several qualities of information:
| Kind | Example |
|---|---|
| Captured | Cursor supplied command, tool_input, duration or failure_type |
| Derived | Events sharing a generation_id are displayed as one turn |
| Heuristic | Overlapping intervals are grouped as a parallel wave |
| Ambiguous | Two calls have identical observable IDs, names and inputs, so no parent is selected |
It is important to understand these kinds instead of blindly trusting the UI.
The blind spots from the first post still apply:
- the assembled system prompt and final context sent to the model are not exposed,
afterAgentThoughtprovides rendered reasoning, not guaranteed private chain-of-thought,- Cursor does not expose a complete user-question/answer or approval-resolution pair,
- hooks can fail, time out or arrive incomplete/empty,
- absence of a hook is not proof that an internal operation did not occur.
The reconstruction adds one more lesson: correlation itself has limits. When the harness does not emit enough discriminating evidence, the honest result is an orphan node.
Conclusion
Here are the important lessons learnt while trying to rebuild a Cursor conversation:
- An ID is only the first clue.
tool_use_idcan be reused, so tool name and canonical input are needed to separate calls. - Arrival order is not causality. Shell and MCP calls can overlap and complete non-LIFO; commands, server identity and inputs are stronger evidence.
- Failures participate in correlation. They close calls and must clean pending state before retries.
- Skill usage is only inferred from evidences. A
SKILL.mdread, slash command and thought mention do not mean the same thing. - A summary is a projection, not an oracle. It is only as complete as what was extracted from the existing triggered hooks.
The next posts will show what happens when trying to feed Claude Code, GitHub Copilot CLI, and VS Code events through this same model. As we will see, using one tree does not mean that every harness provides the same level of visibility on what it is doing.
