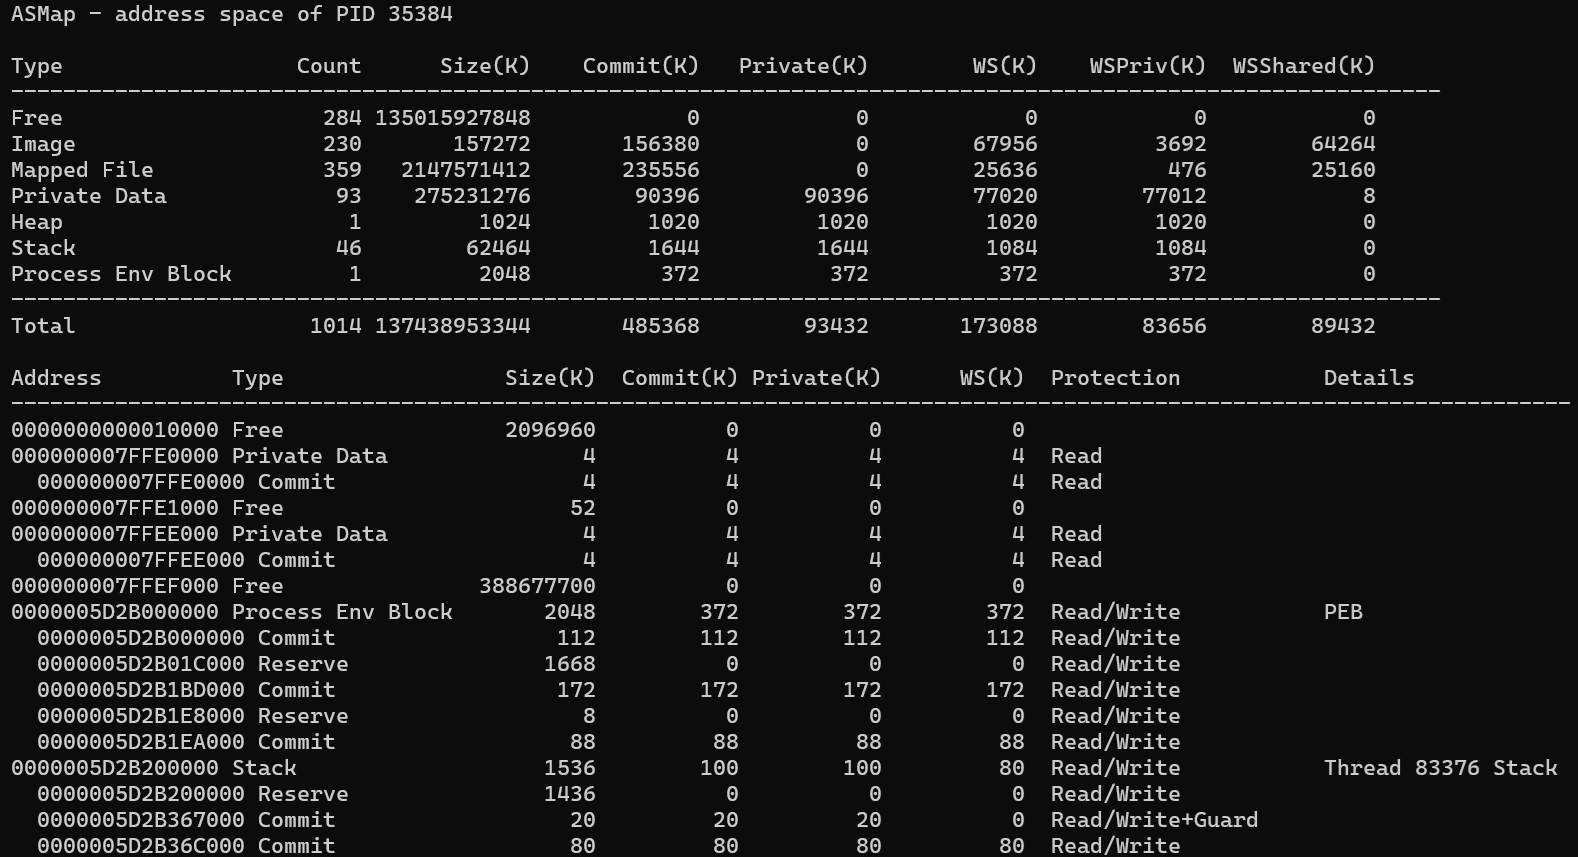
During a recent Datadog event, how to get detailed memory usage on both Windows and Linux was at the center of discussions. One of the goals is to be able to figure out how to improve the memory footprint of our profilers. It happens that, back in 2007, when Jeff Richter and I wrote the 5th edition of Windows via C/C++, chapter 14 shipped a tiny sample called 14-VMMap: a ~560-line GUI demo that walked a process address space with VirtualQueryEx and dumped every region into a list box. It was a teaching tool - just enough to see how reserve/commit and the different storage types are laid out in memory.
I dusted it off, and one thing led to another: I first modernized it into a console tool I called ASMap that gets close to Sysinternals VMMap parity on Windows 11, and then I asked Cursor with Opus 4.8 to port the idea to Linux on top of /proc/<pid>/smaps. The surprising part was not the code - it was discovering how differently the two operating systems account for memory, to the point where the “same” column names (Working Set, Private, Committed) mean genuinely different things.
This post presents the different steps of the journey: the original allocation-base walk, the Windows modernization, and the Linux counterpart with the conceptual gaps that really matter. The C++ tool and the Python script are both available in my ASMap GitHub repository.
A process address space 101
Two OSes, two vocabularies, but the same underlying idea: at some point, “everything” is accessible via a pointer, an address; hence the name address space. On Windows the model is two levels deep:
- A region is everything that shares a single allocation base (one
VirtualAlloc, one mapped file, one loaded image). - A region is subdivided into blocks, pages with uniform state and protection - exactly one
MEMORY_BASIC_INFORMATIONentry. - Each block is in one of three states:
MEM_FREE,MEM_RESERVE(address space claimed, no backing), orMEM_COMMIT(backing promised).
That gives the nesting that the rest of this post keeps coming back to:
Reserved (MEM_RESERVE) ⊇ Committed (MEM_COMMIT) ⊇ Working Set (resident in RAM)
Keep that chain in mind - the whole Windows-vs-Linux comparison at the end is really a story about how each OS treats those three levels.
The 2007 original: a region-base walk with VirtualQueryEx
Two nested loop are at the heart of the original tool. The outer one starts from address 0 and search for regions with VirtualQueryEx. Then for a given region, an inner loop consolidates blocks within that region.
Readers with keen eyes will identify, in the original code, an unneeded call to VirtualQueryEx and I realized it myself just now!
Next, it grabs the AllocationBase, then walks VirtualQueryEx forward as long as the allocation base does not change, summing sizes and counting blocks:
| |
Three design decisions need to be detailed, because the modern tool keeps all of them:
- Reserved blocks inherit the region’s protection. For an uncommitted block
mbi.Protectis meaningless, so the code showsmbi.AllocationProtectinstead. - The storage type is a guess. A region starts as
MEM_PRIVATEand gets promoted toMEM_IMAGE/MEM_MAPPEDthe moment a committed block reveals its real type. That works for committed regions but is unreliable for a reserved-only region, which has no committed block to read a type from. - Stacks are detected by their guard page. After the walk, a region is declared as a thread stack if it saw at least one
PAGE_GUARDblock:
| |
The result was fed into a maximized list box with a few tab stops, plus Refresh, Expand regions, and Copy to clipboard buttons. For each region it printed just the address, storage type, size, block count, and protection, and tried to resolve a module or mapped-file path. Perfect simple sample for a book.
What the original code could not tell you
The moment you try to use it as a real diagnostic tool like VMMap, the gaps jump out:
| Question | 14-VMMap (2007) |
|---|---|
| How much of this is actually in RAM? | no working-set data at all |
| How much is committed vs merely reserved? | only a single “size” |
| Which thread owns this stack? | guessed from a guard page |
| Where are the PEB / TEB / heaps? | not labeled |
| Which PE section is this block? | not labeled |
| Does it handle a 32-bit (WOW64) target? | no |
| Scriptable output? | list box + clipboard |
That list was my to-do list for a new Address Space Map tool; a.k.a. ASMap.
Modernizing into ASMap on Windows 11
ASMap keeps the allocation-base walk almost verbatim - same loop, same protect/type handling - but wraps it in a proper model (Target,Region, Block, a Category enum). The Target class abstracts the process to map with its handle that is used to walk the entire address space range (min and max addresses are retrieved with GetNativeSystemInfo) so that free gaps are enumerated too:
| |
The returned AddressSpace stores the regions in a std::vector<Regions>. From there, the details missing from the original are added in a second pass, region by region.
Authoritative region typing
Instead of guessing the storage type from block types, ASMap uses the under-documented NtQueryVirtualMemory(MemoryRegionInformation) function that returns authoritative type flags (and the true commit size), which override the block-walk guess - crucial for reserved-only regions:
| |
The raw MEM_* constants are replaced by a semantic Category (Free, Reserved, Image, MappedFile, Private, Heap, Stack, Teb, Peb, …), which is what makes the next labeling passes possible.
Working-set accounting: the biggest gap closed
This is the next step to turn a teaching demo into something comparable to VMMap. For every committed block, ASMap batches 4096 pages per call to QueryWorkingSetEx and classifies each resident page:
| |
Note the four buckets: wsTotal, wsShareable, wsShared, and wsPrivate. The distinction between shareable and shared looks pedantic here - it becomes the single most important gotcha when we compare with Linux.
Semantic labels: PEB, TEB, heaps, and PE sections
A generic “Private” region is not enough: is it part of the process heap or a thread’s TEB? ASMap runs four labeling passes that access the target process, from most generic to most specific:
| Pass | Mechanism |
|---|---|
| PE image sections | EnumProcessModulesEx(LIST_MODULES_ALL), then parse each module’s PE header in the target and tag each block with its section (.text, .rdata, …) |
| PEB / PEB32 | NtQueryInformationProcess(ProcessBasicInformation / ProcessWow64Information) |
| Heaps | read PEB.NumberOfHeaps + the ProcessHeaps[] array (x64 offsets 0xE8/0xF0, x86 0x88/0x90) |
| Thread stacks + TEBs | enumerate threads with ToolHelp, resolve each TEB with NtQueryInformationThread(ThreadBasicInformation), read NT_TIB.StackBase |
Ordering matters - images first, threads last - so the most specific label wins:
| |
Compared to Linux (later), notice that ASMap labels every native heap from PEB.ProcessHeaps, not just one.
Thread stacks, done right
This is my favorite upgrade because it fixes a genuine correctness problem. The 2007 heuristic (“a region with a guard page is a stack”) both misses stacks whose guard page moved and false-positives on any other guard page. ASMap instead enumerates the real threads, reads each thread’s TEB, and takes the exact NT_TIB.StackBase:
| |
Now every stack is attributed to a precise thread id. For a WOW64 thread, the 32-bit stack is found through the 32-bit TEB that lives 0x2000 bytes after the 64-bit one. The old guard-page flag is still computed (region.isStackGuess) - a good fallback but it is no longer the source of truth.
WOW64 and the full 64-bit range
ASMap detects bitness with IsWow64Process2 (ARM64-aware), uses GetNativeSystemInfo) so the address-space bounds cover the whole 64-bit user range, and reads target-native pointers (4 bytes under WOW64, 8 otherwise). The 32-bit PEB/TEB/heap offsets are handled explicitly, so a 32-bit target on 64-bit Windows is a first-class citizen.
From a list box to console + CSV
The output is now a structured console report - a per-category summary, then per-region detail, with optional per-block sub-rows (--blocks) and an optional --csv export:

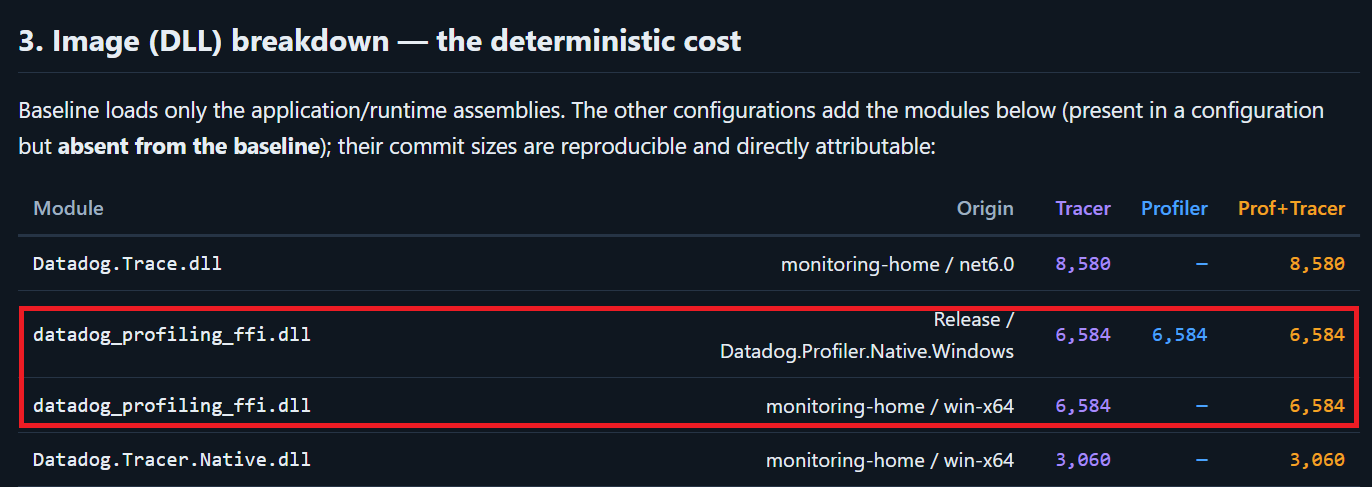
Everything the original showed is still there plus additional summary and details - it is just no longer trapped in a GUI and this is important in these days of AI. The original goal of building this tool was to better understand the additional memory footprint of our Datadog profiler. After generating an output for a baseline and others with our profiler and tracer, I’ve asked Opus 4.8 to analyze the differences and obtained a report that pinpoints the weight of additional loaded dlls:
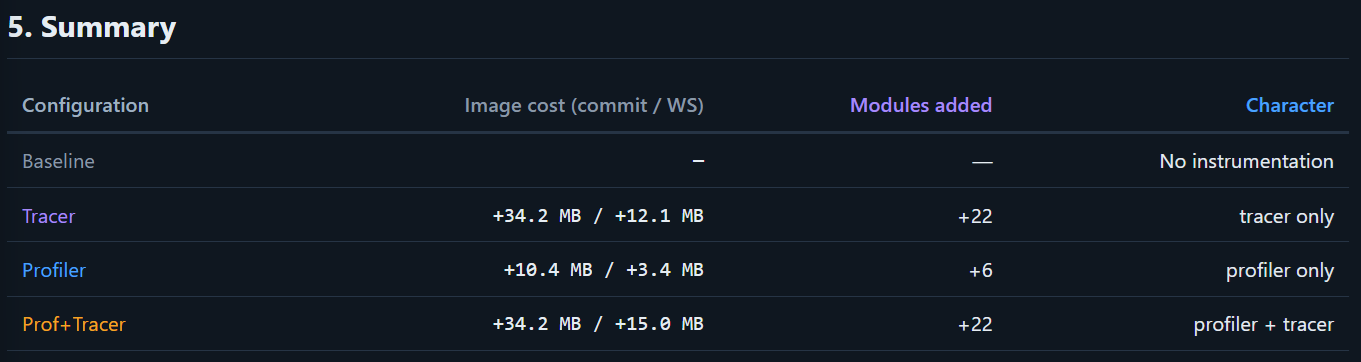
Thanks to the dll names and path, I realized that some of these numbers were wrong due to a local configuration of my dev machine where the same datadog_profiling_ffi.dll file was loaded statically because used by our native profiler following Windows rules and the other one loaded by the .NET runtime following other rules due to P/Invoke calls:
Same goal on Linux: let the kernel do the work
Then came the fun question: what does this look like on Linux? The philosophy is inverted. On Windows the tool does the work - thousands of syscalls, reading the target’s own structures. On Linux the kernel does the work: /proc/<pid>/smaps already contains the per-mapping breakdown as text, so the whole probe is a stdlib-only Python script of ~430 lines that mostly parses a file.
| |
The residency numbers I fought for on Windows (one QueryWorkingSetEx per page) are simply fields here: Rss, Pss, Private_Clean/Dirty, Shared_Clean/Dirty, Referenced, Swap, SwapPss. One file read and the kernel already walked the page tables for you.
VMAs: one level, not two
Linux has no region/block hierarchy. The unit is the VMA (virtual memory area) - one smaps entry, described by perms offset dev inode path. There is no reserve/commit sub-structure and, crucially, no free-space or gap entries: smaps lists only VMAs that exist. So the Linux tool simply cannot show you “reserved-but-uncommitted” or “free” the way ASMap does on Windows - that information is not exposed.
Mapping the categories
The classifier mirrors VMMap’s grouping using the path column and the permission bits:
| |
Three asymmetries are worth mentioning:
- Heaps. Windows labels every heap from
PEB.ProcessHeaps. Linux only knows the singlebrk()heap[heap]. glibc’smallocarenas, and anymmap-based allocator (including those done by the .NET GC), show up as genericAnon Private. So a managed process on Linux shows almost noHeap- its managed heap is anonymous memory. - Image classification is a heuristic. There is no
MEM_IMAGEequivalent. The script collects every file that has at least one executable (x) mapping intoexec_files, then tags all VMAs of those files asImage. It is a good guess, not the authoritative answer Windows provides. - PEB/TEB do not exist. There is no process/thread environment block; thread-local storage lives inside ordinary anonymous/image mappings and is not separately labeled.
When I looked at the Linux output, I scratched my head for some /memfd:doublemapper (deleted) mappings:
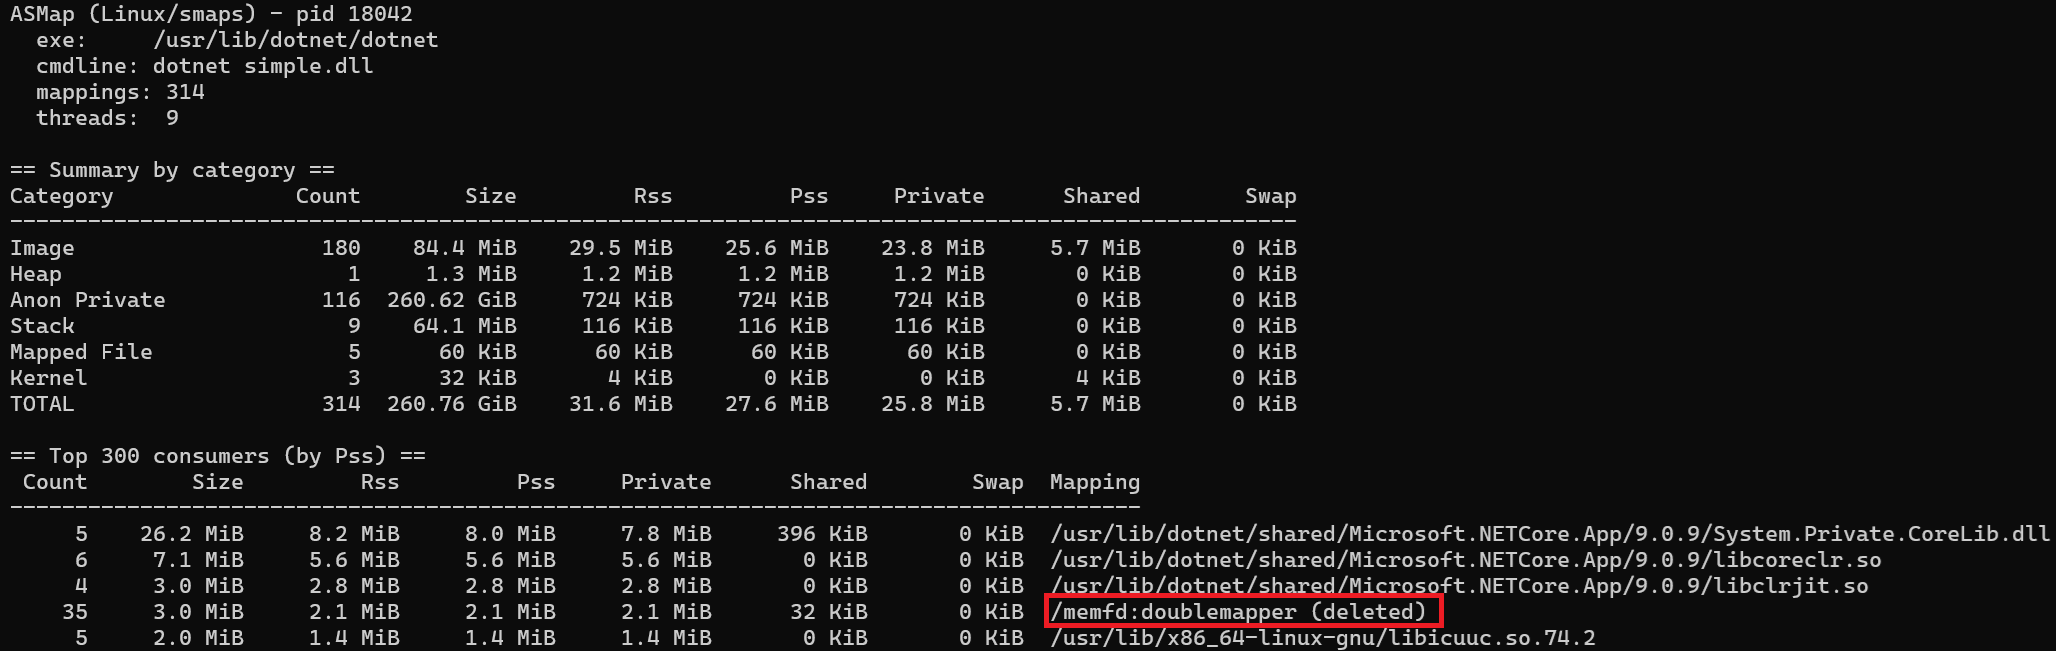
Cursor with Opus 4.8 found the answer for me in seconds:
memfd: — This is an anonymous in-memory file created via the Linux memfd_create() syscall. It’s backed by RAM (tmpfs), has a file descriptor, but no path on any real filesystem. The name after the colon (doublemapper) is just the label passed to memfd_create().
(deleted) — This is normal and expected, not a problem. A memfd has no directory entry anywhere, so the kernel always renders it in smaps/maps with the (deleted) suffix. Don’t read it as “a file was removed.”
doublemapper — This is the giveaway that you’re looking at a .NET process (CoreCLR / .NET Core / .NET 5+). The runtime’s executable-code allocator uses a double-mapping technique to enforce W^X (“write xor execute”) for JIT-compiled code:
- It creates one memfd named
doublemapper. - It maps regions of that memfd twice: a long-lived RX (execute) view that the CPU runs, and short-lived RW (write) views used only while the JIT emits or patches code.
- Because the same physical page is never simultaneously writable and executable at the same address, this hardens the process against certain code-injection exploits.
So this row is essentially the JIT’d/executable code heap of the .NET runtime.
And I even got the link to the related file for the same price! I can’t imagine how many hours I would have spent if I had searched on my own without AI…
Where the two worlds diverge
Now the part I actually find interesting. The two tools print similar-looking tables, but they sit on two different memory-management philosophies. Two columns in particular probably do not mean what you think.
Working Set vs RSS/PSS: “shareable” is not “shared”
Both answer “how much is resident in RAM right now?”, but they split shared pages by different rules:
- Windows
Shareablemeans a page can be shared because it is section/image backed - even if only this one process maps it right now. A DLL’s clean code page mapped by a single process is stillShareable, notPrivate, on Windows. - Linux
Shared_*means the page is actually shared right now, i.e. its physicalmapcount > 1. That same lone-mapped library page is counted asPrivate_Cleanon Linux, because itsmapcount == 1.
So the correspondence is:
| Windows (ASMap) | Linux (smaps) | Caveat |
|---|---|---|
WS (Valid) | Rss | closest 1:1 match |
WSShared (ShareCount > 1) | Shared_Clean + Shared_Dirty | both mean “shared now” |
WSPriv (not Shared bit) | Private_Clean + Private_Dirty | roughly |
WSShareable (Shared bit, any ShareCount) | no equivalent | Linux calls a lone-mapped file page Private |
| (none) | Pss (proportional set size) | Linux-only “fair share” |
| (none) | Referenced, Swap, SwapPss | Linux-only |
The practical trap: for a library-heavy process, Windows WSPriv and Linux Private will not match, because Windows moves shareable-but-single-mapper pages out of Private while Linux keeps them in. And Linux adds two things Windows never exposes: PSS (each resident page counted as 1/mapcount, the real “what does this process cost” number) and clean vs dirty (Private_Dirty is what would hit swap under pressure). QueryWorkingSetEx has no clean/dirty bit at all.
Committed memory: the models don’t line up
This is the deepest gap, and the reason why the Linux tool has no “Committed” column.
On Windows, commit is an explicit, enforced, up-front promise. Committing a page charges it against the commit limit = RAM + pagefile. Once committed, touching the page is guaranteed not to fail for lack of memory - it may be resident, demand-zero, or paged out, but the resource is reserved. Hence Commit ≥ Working Set, and ASMap reports Commit(K) straight from the MEM_COMMIT block sizes.
On Linux, mmap just creates a VMA; physical pages are demand-allocated on first touch, and by default the kernel overcommits. There is no per-page commit charge and therefore no per-mapping “Committed” field in smaps. The available proxies are all imperfect:
Size(VSS) - the VMA length. Over-counts wildly: it includes never-touched andPROT_NONEreservation ranges. (In one .NET example the CLR reserved ~260 GiB ofAnon PrivateVSS with under 1 MiB resident - pure address reservation, not “commit” in any Windows sense.)Rss + Swap- memory actually consumed; closer to Working Set + pagefile than to Committed.
The behavioral inversion is the thing to remember:
flowchart LR
  subgraph Windows["Windows: commit = hard promise"]
    W1["VirtualAlloc(commit) succeeds"] --> W2["backing store charged against RAM+pagefile"]
    W2 --> W3["touching the page always works"]
  end
  subgraph Linux["Linux: default overcommit"]
    L1["mmap/malloc succeeds"] --> L2["no charge; pages lazy on first touch"]
    L2 --> L3["out of RAM+swap? OOM killer picks a victim"]
  end
Linux does track a system-wide estimate (Committed_AS in /proc/meminfo) and a CommitLimit, and vm.overcommit_memory=2 enforces Committed_AS ≤ CommitLimit - the mode that behaves most like Windows. But it is system-wide and estimate-only, never a per-process, per-page guarantee. The nearest per-mapping analogue to MEM_RESERVE is a PROT_NONE VMA (address reserved, inaccessible, uncharged), which runtimes use for reserve-then-mprotect-on-demand - functionally reserve/commit, but the kernel never accounts the mprotect as “commit.”
| Windows term | Linux nearest | Match quality |
|---|---|---|
Reserved (MEM_RESERVE) | PROT_NONE / untouched VMA range | conceptually close; not labeled by the Linux tool |
Committed (MEM_COMMIT) | (none per-mapping); Committed_AS system-wide | poor - different model |
| Commit limit (RAM + pagefile) | CommitLimit (overcommit mode 2 only) | close only under strict mode |
| Working Set | Rss | good |
| Private committed | Private_Dirty (+ anon) | rough |
| Pagefile-backed, not in WS | Swap / SwapPss | good |
| Free address space | (not represented) | absent on Linux |
- Windows: a default stack is 1 MiB reserved, a small committed portion, and a
PAGE_GUARDpage to grow the committed part of the stack when needed. ASMap shows the reserved region, the committed sub-block, and the guard - the full reserve/commit/WS picture - and finds it precisely viaTEB.NT_TIB.StackBase. - Linux: a pthread stack is a default 8 MiB anonymous mapping, demand-paged, so
Sizeis 8 MiB withRssa few KiB - the same reserved-vs-resident spread, but with no committed middle layer to report. The kernel only labels the main[stack]; the script recovers worker-thread stacks from/proc/<tid>/syscall, whose second-to-last value is the stack pointer register:
| |
That needs ptrace-attach rights (own/child process, root, or kernel.yama.ptrace_scope=0), which is itself a nice reminder that Linux makes you earn the cross-thread visibility Windows gives you with NtQueryInformationThread.
Thread stacks, both ways
Stacks illustrate the whole model difference in one object:
Trust but verify: cross-checking the totals
Both tools validate their sums against an independent source of truth. The Linux script compares its summed Rss/Pss against the kernel-authoritative /proc/<pid>/smaps_rollup:
== Cross-check vs smaps_rollup ==
  Rss  computed=  391540  rollup=  391512  diff=   +28 kB
  Pss  computed=  228104  rollup=  228104  diff=    +0 kB
On Windows the analogue is GetProcessMemoryInfo / WorkingSet64 and PrivateMemorySize64. One subtlety: smaps is a single, mostly-consistent kernel snapshot, whereas ASMap issues thousands of QueryWorkingSetEx calls while the target keeps running, so its totals can drift a little during the walk. Small diffs are expected.
What each platform uniquely gives you
Windows-only
- Explicit Reserved vs Committed vs Free breakdown.
- PEB / TEB and all native heaps (via
PEB.ProcessHeaps). - Per-block PE section names (
.text,.rdata, …). - Shareable (potential-sharing) working-set accounting.
Linux-only
- PSS / SwapPss proportional accounting.
- Clean vs dirty and Swap per mapping.
- Referenced (recently-accessed) pages.
- Named anonymous VMAs (
[anon:...]) and[vdso]/[vvar]kernel pages. - The whole breakdown for the cost of a single file read.
Wrapping up
The two tools look like twins because they present the same VMMap-style tables, but they measure two different philosophies:
- Residency maps cleanly: Windows Working Set ≈ Linux RSS. The gotcha is shared accounting - Windows “Shareable” (potential) is not Linux “Shared” (actual
mapcount > 1) - and Linux adds PSS and clean/dirty that Windows does not expose. - Commit does not map: Windows commit is an enforced, per-page, up-front guarantee against a RAM+pagefile limit; Linux allocates lazily and (by default) overcommits, so there is no reliable per-process “committed” figure - only the system-wide, estimate-only
Committed_AS, and the OOM killer instead of a hard promise.
So the single most useful number differs by platform: on Windows it is Private (committed) + Working Set; on Linux it is PSS (with Private_Dirty for the swap-bound cost).
None of that changes the big picture: the 2007 allocation-base walk is still beating at the center of both tools, nineteen years later. Rebuilding it into ASMap - and then arguing with Linux about what “committed” even means - was the most fun I have had with VirtualQueryEx in a long time (with a good amount of help from Cursor and Opus 4.8 along the way).
The full source for the Windows tool and the Linux asmap_smaps.py script is in my ASMap GitHub repository.
Happy coding!
References
- Sysinternals VMMap: documentation & download
VirtualQueryEx/MEMORY_BASIC_INFORMATION: Win32 docsQueryWorkingSetEx/PSAPI_WORKING_SET_EX_INFORMATION: Win32 docsNtQueryVirtualMemoryandMEMORY_REGION_INFORMATION: NT memory information classes- Linux
proc(5)man page (smaps / smaps_rollup fields): man7.org - Linux overcommit accounting: Documentation/mm/overcommit-accounting
- For related target-memory reading and PE parsing, see my earlier posts: Reading CLR internals the cDAC way and How to dump function symbols from a .pdb file
