The previous episode detailed how to find the events dealing with network requests that are emitted by the BCL classes with their undocumented payload. It is now time to see how to listen to them and extract valuable insights such as what is happening when an HTTP request is sent to a server as an example. This is how my new dotnet-http CLI tool is implemented.
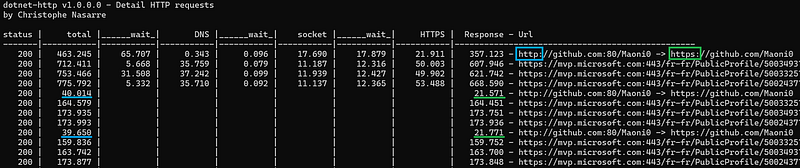
You are now able to see the cost of DNS, socket connection, security and redirection as shown in the following screenshot.

As you can see, the cost of an unexpected redirection could be high and hides security handshakes. In this example, using https://github.com/Maoni0 instead of http://github.com/Maoni0 divides by 2 the request duration!
Once the DNS checks are done, the socket connections are established, and the security handshakes are validated, the corresponding phases are no more needed for the next requests.
Listen to custom EventSource events
As explained in previous posts, it is easy to listen to events emitted by .NET application thanks to the Microsoft TraceEvent nuget. You also need to use EventPipeClient from the Microsoft.Diagnostics.NETCore.Client nuget to connect to the running application. In my case, I’m relying on an older version that supports both ETW and EventPipe:
| |
The configuration contains a list of providers that are emitting the events you are interested in with the right keyword and verbosity. Here is what is needed for the HTTP requests monitoring :
| |
You might be surprised by the presence of the TplEventSource provider but it is required to get a correct ActivityID. This major subject is detailed later.
There are so many events to listen to that it is easier to listen to the source AllEvents C# event:
| |
This global handler passes the events to ParseEvent that forwards the important data to handlers for each provider:
| |
The next step is to handle each event based on its id:
| |
Extract information from an event payload
The payload of each event has been detailed in the previous post. For example, I need to extract the following fields from the RequestStart event payload:
| |
I’ve implemented the EventSourcePayload class that provides strongly typed helpers to get the different fields one after the other:
| |
It accepts the payload as the array of bytes received by each handler.
A string information is serialized as a list of UTF-16 Unicode characters; each one stored in 2 bytes:
| |
The current position in the array is incremented character by character up to the final ‘\0’.
The other helpers implementation is straightforward thanks to the BitConverter class:
| |
Again, the position in the array is incremented to reflect the size of the field being read.
If you look at the rest of the OnRequestStart handler, you will see how each field is extracted:
| |
My activity or not my activity: that is the question
In the previous episode, I forgot (on purpose) to mention that the EventSource is keeping track of “activities” when emitting events:
| |
The WriteEventWithRelatedActivityIdCore method looks at the event metadata and if its opcode is Start then a new activity is created; if it is Stop then the current activity ends:
| |
These OnStart and OnStop methods are doing nothing if the TplEventSource is not enabled with Keywords.TasksFlowActivityIds (= 0x80) set. This explains the code in GetProviders listed earlier where this non-HTTP provider is enabled.
When a request is created, the current global count managed by the ActivityTracker is incremented and it becomes the id of the current activity. Note that there is a “root” identifier before any activity gets created corresponding to the current AppDomain ID; starting at 1. If you think of an HTTP request, after a RequestStart event, each phase starts a new activity with, for example, ResolutionStart or ConnectStart. Informative events are emitted with the current request activity such as Redirect or ConnectionEstablished.
Here is a simplified view of the events emitted for an HTTP request (without DNS nor security events):
Thread +-- Path >------- ID ---- Opcode -- Event ----------------------------------
 78568 |    1/1 >  event  1 __ [ 1| Start] RequestStart
       |
 32388 |  1/1/1 >  event  1 __ [ 1| Start] ResolutionStart
       |
 32388 |  1/1/1 >  event  2 __ [ 2|  Stop] ResolutionStop
       |
 32388 |  1/1/2 >  event  1 __ [ 1| Start] ConnectStart
       |
 32388 |  1/1/2 >  event  2 __ [ 2|  Stop] ConnectStop
       |
 32388 |    1/1 >  event  4 __ [ 0|  Info] ConnectionEstablished
       |
 53324 |    1/1 >  event  6 __ [ 0|  Info] RequestLeftQueue
       |
 53324 |  1/1/3 >  event  7 __ [ 1| Start] RequestHeadersStart
       |
 53324 |  1/1/3 >  event  8 __ [ 2|  Stop] RequestHeadersStop
       |
 68024 |  1/1/4 >  event 11 __ [ 1| Start] ResponseHeadersStart
       |
 68024 |  1/1/4 >  event 12 __ [ 2|  Stop] ResponseHeadersStop
       |
 68024 |  1/1/5 >  event 13 __ [ 1| Start] ResponseContentStart
       |
 68024 |  1/1/5 >  event 14 __ [ 2|  Stop] ResponseContentStop
       |
 68024 |    1/1 >  event  2 __ [ 2|  Stop] RequestStop
  200 <|
As you can see, different threads are emitting events associated to the same request. At the ActivityTracker level, an ActivityInfo is stored in an async local so that each thread has its own storage that will be propagated by the methods of the Task Parallel Library (a.k.a. TPL) from task to task. This is why the very asynchronous code of the HTTP client implementation can go back to the current activity from different threads.
The activities are encoded into the 16 bytes of a GUID. In fact, only the first 12 bytes are used, and the final 4 bytes contain a checksum that includes the current process ID. Since the activity identifiers in the path do, most of the time, have a small value, the encoding is using 4 bits, also known as a nibble, to encode each of them. There was a bug in ActivityTracker.AddIdToGuid that will be fixed in .NET 10. Unfortunately, the decoding code in Perfview needs to take it into account so the last activity is not lost.
Computing the different durations
With this infrastructure in place, it is now possible to extract the “root” activity path corresponding to an HTTP request during each phase and update the corresponding state that is used to output the details when a request ends:
| |
As you have seen earlier, the different phases of a request may be processed by different threads. It means that an available thread needs to be found in order to execute them. If the thread pool is busy, you can expect some wait time. This is shown in the different wait sections between the phases. They are easily computed using the timestamp of each event. Having long wait durations might be reduced by increasing the number of threads in the thread pool.
Feel free to use the new dotnet-http CLI tool available from nuget.org or via dotnet tool install -g dotnet-http.
The corresponding sources are available from my github repository in case you would like to integrate this kind of analysis directly in your code or your monitoring pipeline.
Happy monitoring!