Introduction
While working on the second edition of Pro .NET Memory Management, it was needed to get statistics about each garbage collection to explain the condemned generation and other decisions taken by the GC. This post explains the different internal data structures used by the GC and how to get their value for each collection. Some require debugging the CLR and others are emitted via events. For the latter, I will show how I wrote the new dotnet-gcstats CLI tool to collect them and a personal Perfview GCStats displaying live data, garbage collection after garbage collection.
High level view of GC Internals
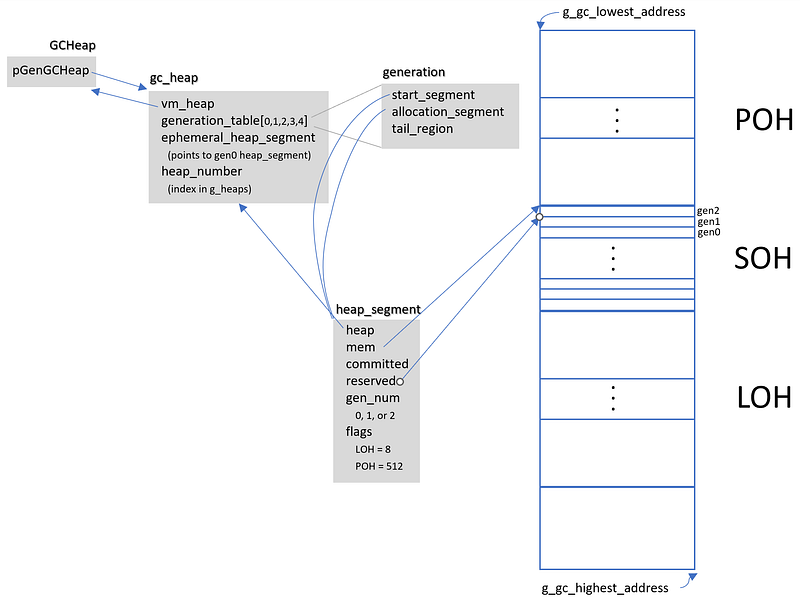
With regions, the GC keeps track of managed memory allocated by your application in instances of the gc_heap class. In Workstation mode, only 1 instance exists and in Server mode, by default, 1 instance is created per core. Each gc_heap keeps track of its 5 generations (gen0, gen1, gen2, Large Object Heap and Pinned Object Heap) in an array of 5 generation instances. Each generation references its dedicated regions wrapped by instances of heap_segment. These regions are reserved from a giant part of the process address space and committed as needed.
During a garbage collection, the GC code relies on global fields per gc_heap:
| |
The settings field contains a few interesting fields:
| |
including the trigger reason that will tell if your code called GC.Collect (i.e. induced), or if it was due to a LOH or SOH allocation for example. If compaction is true, a compacting GC will happen (instead of a sweeping one).
The gc/bgc_data_global contains almost the same information:
| |
Most of the fields are available from different events:
- GCStart: gc_index in Count, condemned_generation in Depth, reason in Reason
- GCGlobalHeapHistory: pause_mode in PauseMode and some others in GlobalMechanisms
Which generation to collect = condemned generation
The computation of the condemned_generation is complicated and relies on many factors including metrics stored for each “generation” (gen0, gen1, gen2, LOH and POH) in an array of dynamic_data called dynamic_data_table. The dynamic_data class contains a few fields used by the GC to take decisions such as when a collection should be triggered and which generation to condemn:
| |
Most of these fields are found in the payload of GCPerHeapHistory or GCHeapStat events. However, the most interesting one, new_allocation is not available. Why is it interesting? Because it would give you which generation had its budget exceeded. It is initialized with the generation budget at the end of a GC and then, each time an allocation context gets created, its size is deducted from it. When it reaches 0, it means that the budget is exceeded, and a collection should happen.
Since I needed to debug the CLR to better understand all these algorithms, I added a breakpoint at the beginning of gc_heap::garbage_collect with the following action:
#{settings.gc_index}[{gc_trigger_reason}]{"\n",s8b} new_allocation(0) = {dynamic_data_table[0].new_allocation}{"\n",s8b} desired_allocation(0) = {dynamic_data_table[0].desired_allocation}{"\n",s8b} begin_data_size(0) = {dynamic_data_table[0].begin_data_size}{"\n",s8b} promoted_size(0) = {dynamic_data_table[0].promoted_size}{"\n",s8b}-{"\n",s8b} new_allocation(1) =
...
{dynamic_data_table[4].new_allocation}{"\n",s8b} desired_allocation(4) = {dynamic_data_table[4].desired_allocation}{"\n",s8b} begin_data_size(4) = {dynamic_data_table[4].begin_data_size}{"\n",s8b} promoted_size(4) = {dynamic_data_table[4].promoted_size}{"\n",s8b}__________{"\n",s8b}
And now, each time a GC happens, I get the corresponding log in my Output pane in Visual Studio:
#2[reason_alloc_soh (0)]
 new_allocation(0) = -22728
 desired_allocation(0) = 134217728
 begin_data_size(0) = 8391376
 promoted_size(0) = 8383432
-
 new_allocation(1) = -5910416
 desired_allocation(1) = 2473016
 begin_data_size(1) = 375528
 promoted_size(1) = 353288
-
 new_allocation(2) = -91144
 desired_allocation(2) = 262144
 begin_data_size(2) = 0
 promoted_size(2) = 0
-
 new_allocation(3) = 28000088
 desired_allocation(3) = 28000088
 begin_data_size(3) = 8000024
 promoted_size(3) = 8000024
-
 new_allocation(4) = 3145728
 desired_allocation(4) = 3145728
 begin_data_size(4) = 32712
 promoted_size(4) = 32712
As you can see, gen0, gen1 and gen2 have all their budget exceeded (i.e. their new_allocation is negative) and it explains why a simple gen0 collection (from allocation in SOH = gen0) becomes a gen2 collection. If you wonder how gen1 and gen2 budgets are exceeded as your application is only allocating in gen0, you need to understand that when a GC copy surviving objects from one younger generation to the older, they are counted as allocations in the older and subtracted from its new_allocation metric.
The GC is encoding the different steps leading to the final condemned generation in a 32 bit value stored in a gen_to_condemn_tuning field that allows you to get:
- initial condemned generation,
- final generation to condemn,
- which generation’s budget is exceeded.
The value of the last one corresponds to the highest generation for which its new_allocation was negative.
This information is available in the CondemnReasons0 field of the GCPerHeapHistory event, and you need some arithmetic to get the generation you want:
| |
Building your own tool
Even though I could dig into the different matrices available in the Perfview’s GCStats view or its export to Excel, I decided to write dotnet-gcstats. This CLI tool listens to the CLR events emitted by a .NET application thanks to Microsoft.Diagnostics.NETCore.Client (connect to the application EventPipe) and TraceEvent (receive and analyze the CLR events).
The code is amazingly simple:
| |
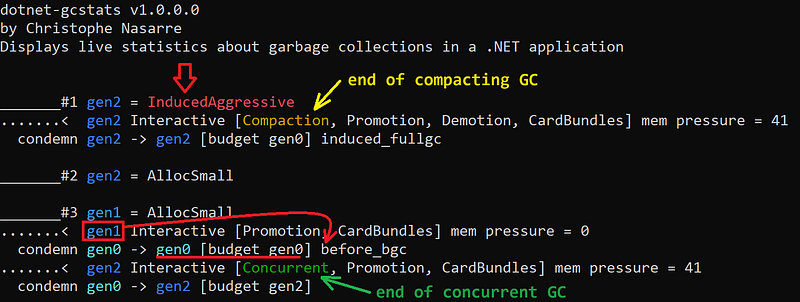
Each event handler is responsible for extracting and translating the interesting fields of its event payload with a few color enhancements:
- GCStart: collection count and reason (highlight induced collections).
- GCGlobalHeapHistory: condemned generation, pause mode and memory pressure.
- GCPerHeapHistory: starting -> final condemned generation and for each heap, budget, begin size, begin obj size, final size, promoted size and fragmentation.
The final step was to transform a simple console application into a .NET CLI tool that everyone will be able to install with dotnet tool install -g dotnet-gcstats and use with dotnet gcstats
| |
In addition, I provided a few additional details:
| |
Once built, I simply uploaded the generated package to nuget.org et voila!
Now, you should be able to better understand why some collections are triggered:

And if it is not enough, wait for reading the second edition of Pro .NET Memory Management ;^)