
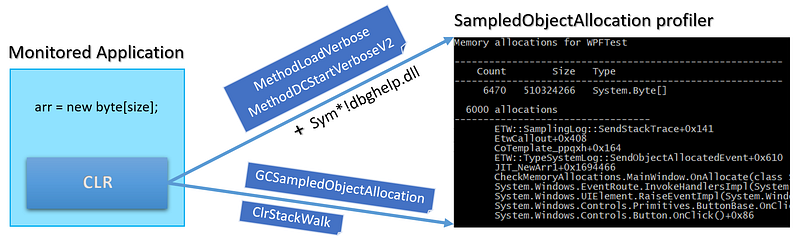
In the previous episode of this series, you have seen how to get a sampling of .NET application allocations thanks to the AllocationTick and GCSampleObjectAllocation(High/Low) CLR events. However, this is often not enough to investigate unexpected memory consumption: you would need to know which part of the code is triggering the allocations. This post explains how to get the call stack corresponding to the allocations, again with CLR events.

Introduction
If you look carefully at the payload of the TraceEvent object mapped by Microsoft TraceEvent library (not my fault if they have the same name) for each CLR event, you won’t see anything related to a call stack. However, in the TraceEvent sample 41, the following line looks promising:
var callStack = data.CallStack();
with data being a TraceEvent object received for each CLR event!
This CallStack method is an extension method provided by the TraceLog special kind of event source. You might not have noticed but I have used it in the AllocationTick code sample from the previous post. This class (and many more helper classes) is doing a lot of work to :
- “attach” a call stack to each CLR event; i.e. a list of addresses of assembly code
- to translate addresses into string symbols (method names or full signatures), listen to a bunch of JIT related events for managed methods (more on this later), using COM-based Debug Interface Access (a.k.a. DIA) and MetadataReaderProvider** **for native functions
Notice that since events from all managed processes on the machine are handled by TraceLog, the internal cache for JITted methods description could consume a lot of memory. During my tests with two Visual Studio running, my test profiler consumed more than 500 MB before even handling call stacks. If you are in such an environment with multiple .NET processes, I will show how to “manually” get the same stacks (+ symbols in the next episode) with CLR events and a few methods from dbghelp.dll in a cheaper way.
The new provider (more on ClrRundown later), keywords and events need to be received to make all this work:
TraceLog: the easy way
As you have seen in the previous posts, the TraceEventSession class exposes a Source property of ETWTraceEventSource type. This source has event parsers properties from which you register handler methods that will be called when CLR events are received. Instead of directly using this source, you should wrap it with a TraceLogEventSource object that provides the same event parsers.
| |
What’s new with providers?
The code for mySetupProviders method is a little bit different from the previous post even though no new event listeners are needed:
| |
- The kernel provider needs to be enabled with the ImageLoad and Process keywords in order to let TraceEvent detect when a process loads “images” (i.e. dlls) and at which address (needed to convert Relative Virtual Addresses (RVA) to addresses in the address space). Note that this provider must be enabled before any other provider or your code will trigger an exception.
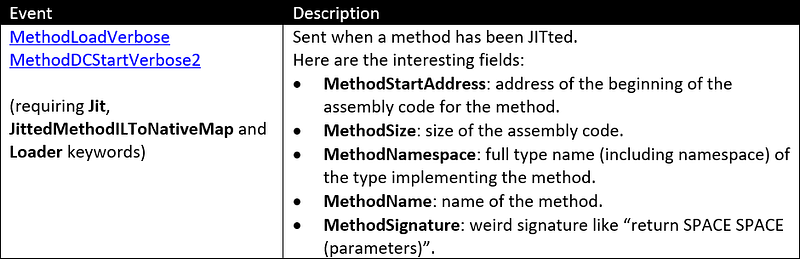
- The CLR provider needs to be enabled with Jit, JittedMethodILToNativeMap, and Loader (in addition to the usual GC one).
- The Stack keyword has to be set on the same CLR provider to receive call stacks events for “normal” CLR event (more on this later)
- The CLR Rundown provider is enabled with the same Jit, JittedMethodILToNativeMap, and Loader keywords. That way, JIT events corresponding to already JITted methods will be received (not only the new ones). This is important because otherwise, you won’t be able to map these methods with the address in memory of their JITted native code in the case of processes that have been started before the profiler. This is the case for my AllocationTickProfiler sample.
Callstacks and symbols
Now, when an AllocationTick event is received, calling the CallStack extension method on the GCAllocationTickTraceData argument returns a TraceCallStack object. This class is a linked list of TraceCodeAddress representing each stack frame (i.e. address in assembly code). These classes are at the heart of TraceEvent and Perfview callstack management. The method names and signatures are retrieved behind the scene thanks to JIT events and the SymbolReader class that digs into .pdb files.
You first need to initialize a SymbolReader instance:
- Set the path to find the .pdb; including the Microsoft HTTP endpoint for public .NET versions symbols,
- Allow pdb next to the executable to be loaded.
| |
Then, displaying a TraceCallStack from a received CLR event in a human-readable format is simple:
- Get one frame after the other from the linked list,
- If the
CodeAddressfield is not cached yet, load the symbols for its module, - Display the
FullMethodNamefield of the frame (or the address if not found).
| |
Note that the first frame in the linked list is the last on the stack (i.e. last executed method).
As I mentioned at the beginning of the post, I have been facing OutOfMemory errors due to the TraceEvent symbols management large memory usage when a few other .NET applications were running. Let’s see how to get the call stacks in a less memory consuming way.
Manually rebuilding the allocations call stack
Instead of using the call stack and symbol management provided by TraceLog in TraceEvent, I would prefer to manually get them. If you remember the last post, thanks to GCSampledObjectAllocation CLR events, it is possible to have a sampling of the allocation size and count per process and per type. What I would like to add to the type picture is the list of call stacks leading to these allocations.
How to manually get CLR events call stack
The first step is to understand how to get the CLR events call stacks. If you use the TraceLog-based code just presented, you should see the following kind of call stack:
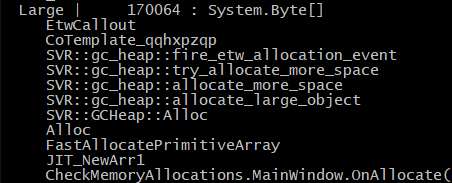
The ETWCallout CLR helper function is in charge of sending a special event containing the call stack of other normal events from the four supported CLR providers. If you set the Stack keyword to the CLR provider, each time an event is sent by a thread, a ClrStackWalk event will be sent just after. It means after each SampleObjectAllocation event, a ClrStackWalk event containing the call stack will be immediately received. In fact, since an application will probably be using more than one thread, it is required to do the mapping between the two events on a per-thread basis.
Each allocation event received by the OnSampleObjectAllocation handler contains the ThreadID property so it is easy to keep track of the last received allocation event per thread. In my case, the ProcessAllocations class stores this information in its _perThreadLastAllocation field:
| |
Now, each time a SampleObjectAllocation event is received, the id of the sending thread is passed to the updatedProcessAllocations.AddAllocation() method:
| |
The _perThreadLastAllocation dictionary stores the AllocationInfo per thread. If an allocation happens, it is added into the dictionary. When a ClrStackWalk event is received for a given thread, the stack will be associated with the last AllocationInfo and removed from the dictionary. If some events are missed (it never happens during my tests but who knows), error message could be logged.
The ClrStackWalkTraceData argument received by the ClrStackWalk listener has a FrameCount property that returns the number of frames in the call stack. In addition, its InstructionPointer() method takes a frame position in the stack (starting at 0) and returns the address (in assembly code) at this position on the call stack.
| |
The AddressStack class returned by BuildCallStack stores the frames as a list of addresses so it can be stored in AllocationInfo.
| |
This class overrides the Equals method for a single reason: I want to be able to detect when the “same” stack (i.e. with the exact same frame addresses) is received for a given type allocation. That way, I just need to keep a counter for each different AddressStack and not all call stacks in AllocationInfo. Remember that AllocationInfo is used to keep track of allocations per type:
| |
The StackInfo class contains an AddressStack and how many times it led to this type of allocation.
| |
So, when a stack event is received, AddStack is called on the last AllocationInfo for the same thread:
| |
The job of AllocationInfo.AddStack() the method is to check if a previous allocation was made with the same call stack (hence the Equals override). If this is the case, just increment the corresponding StackInfo count. Otherwise, create a new StackInfo for this call stack with a count set to 1.
| |
Knowing the address in code of each frame for all events call stack is nice but it would be much more useful to translate them into method names… You have to deal with two different cases: managed and native methods. I will cover these topics in the next episode.
Resources
Missed the first part of this story? Check this out:
Interested in joining our journey? Check this out:
Product, Research & Development | Criteo Careers careers.criteo.com